
This section describes how users can monitor the progress and completion state of a job.
Monitoring your jobs
Once a job has been created and started, you can monitor its progress by navigating to the Monitor tab or by clicking on the name of the job on any screen. The monitoring tab shows you a list of executed jobs, their progress as well and their current status. To get even more detail on the progress of an individual job, click on the Job Name.
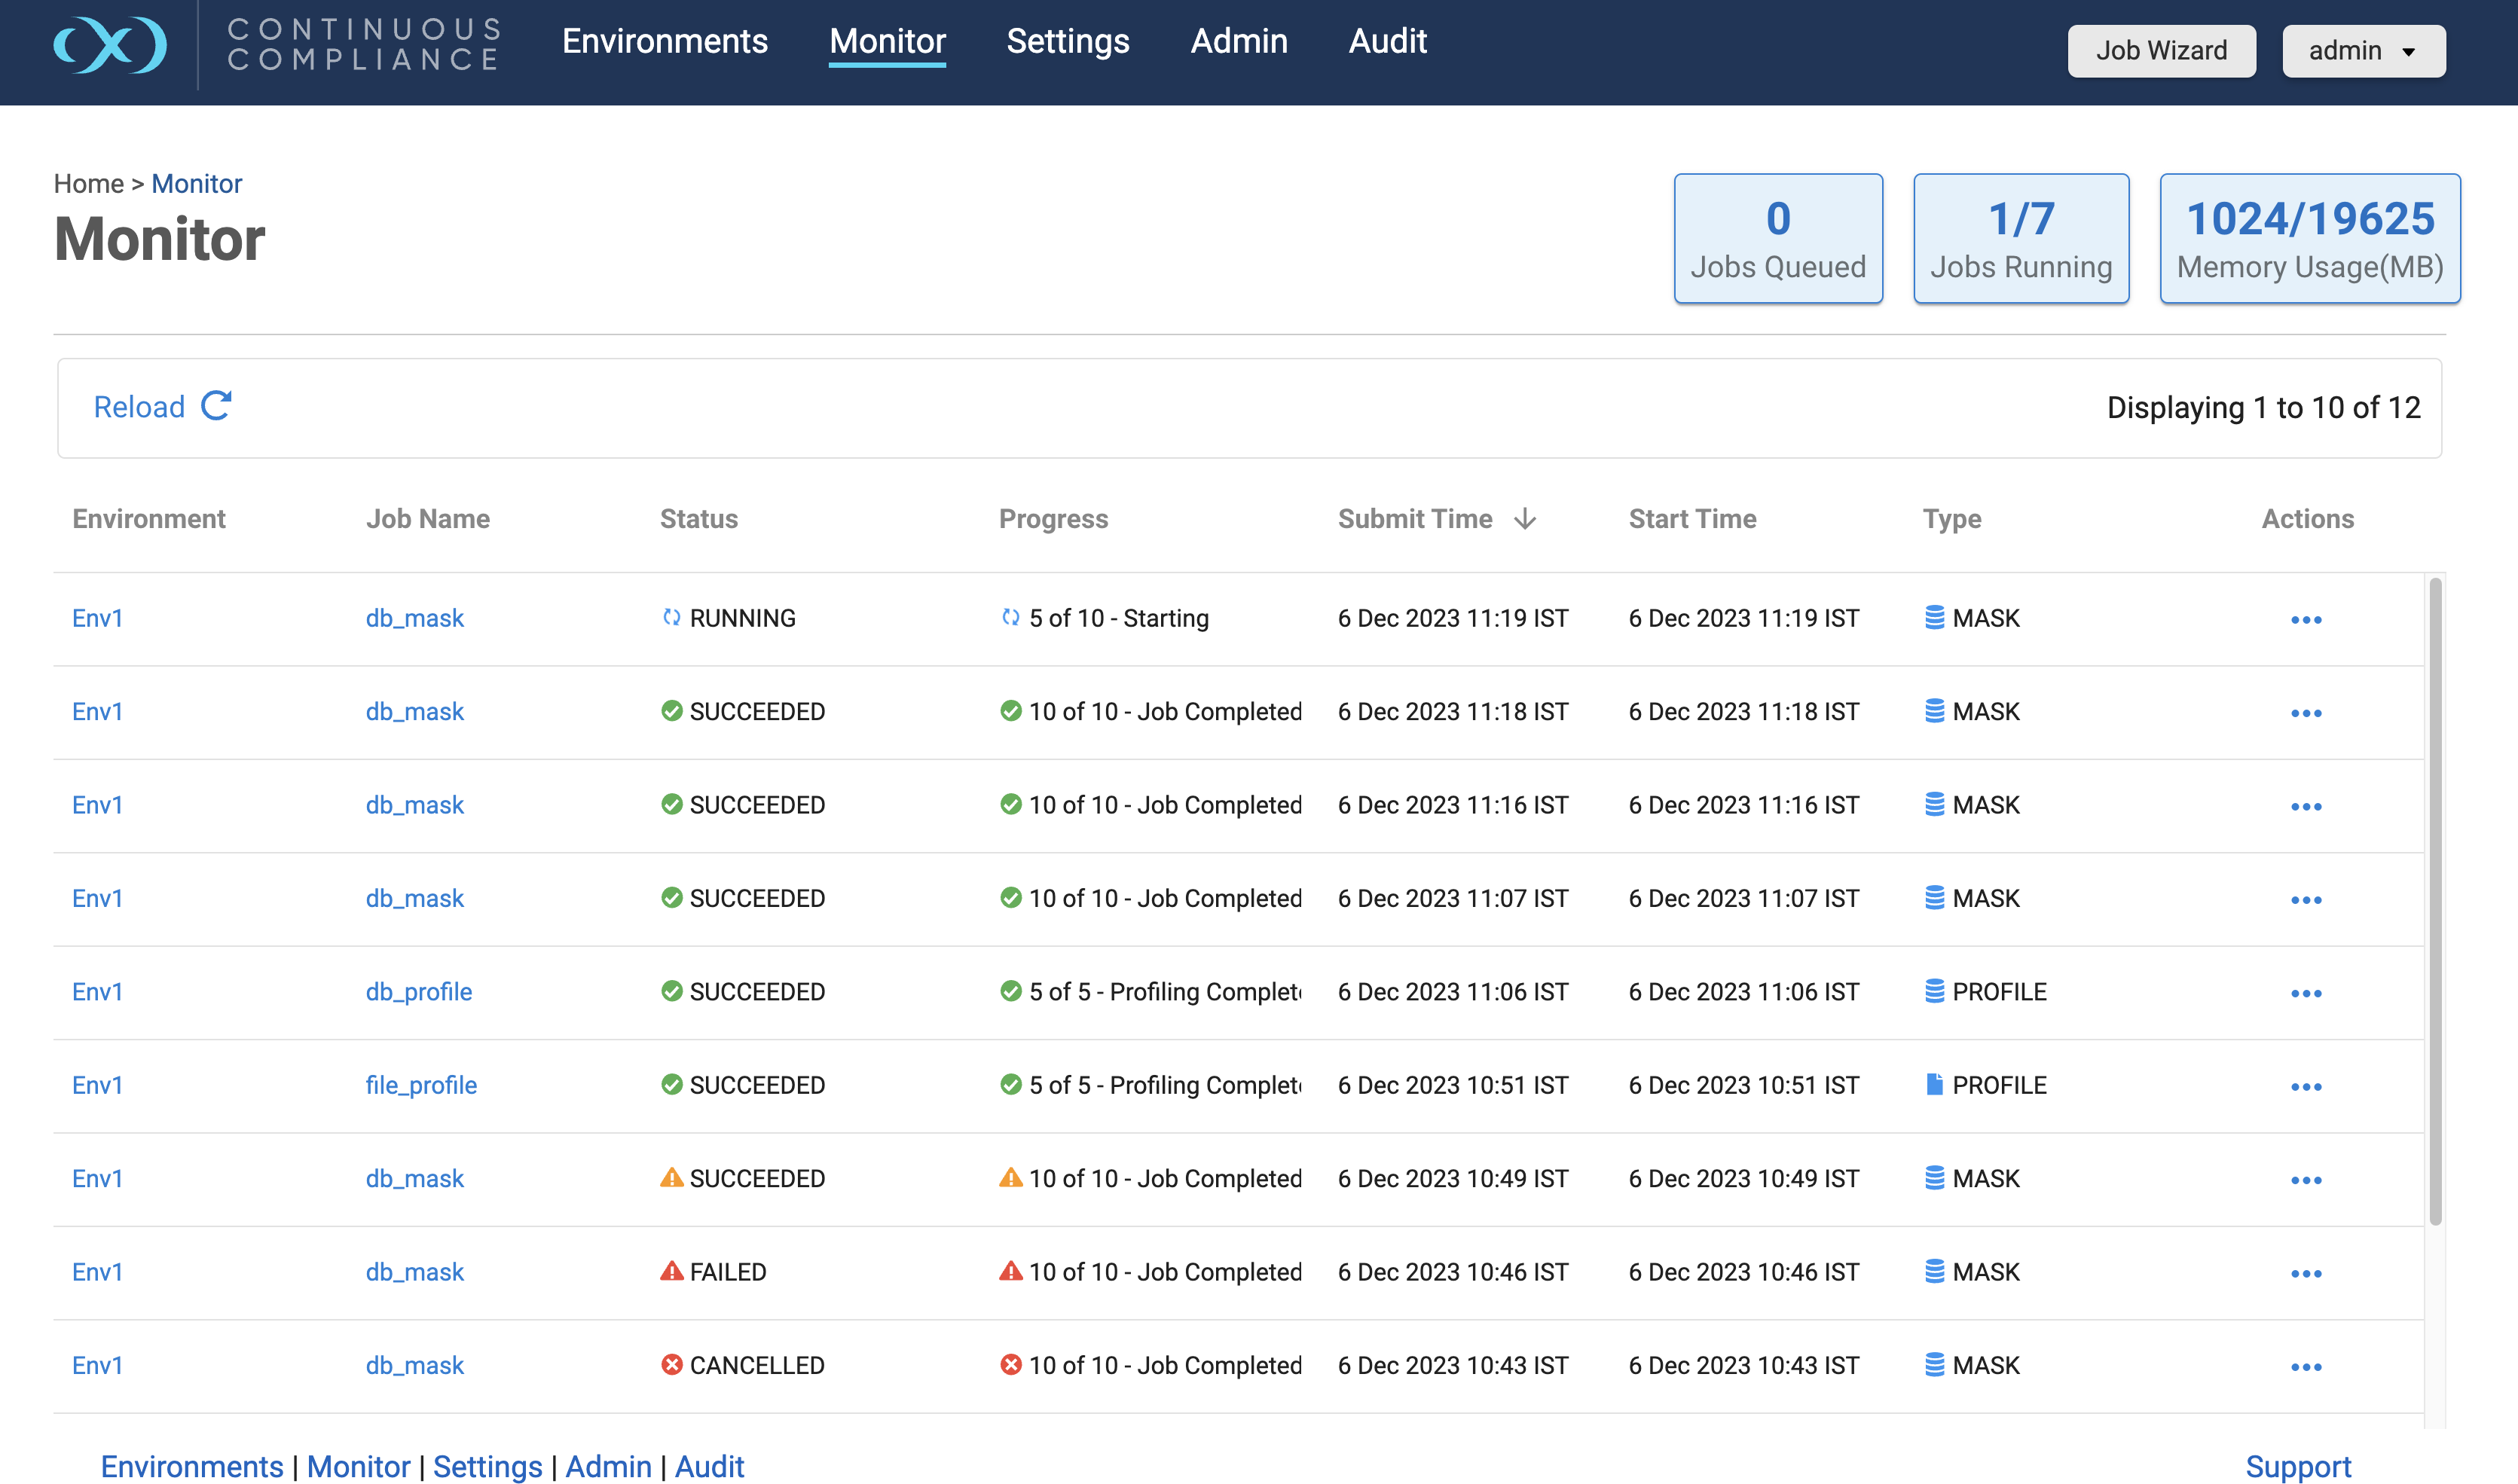
Jobs Queded refers to the number of jobs in the Jobs Queue. When the limit is reached for running the maximum number of jobs and any job is triggered then it moves to Jobs Queue.
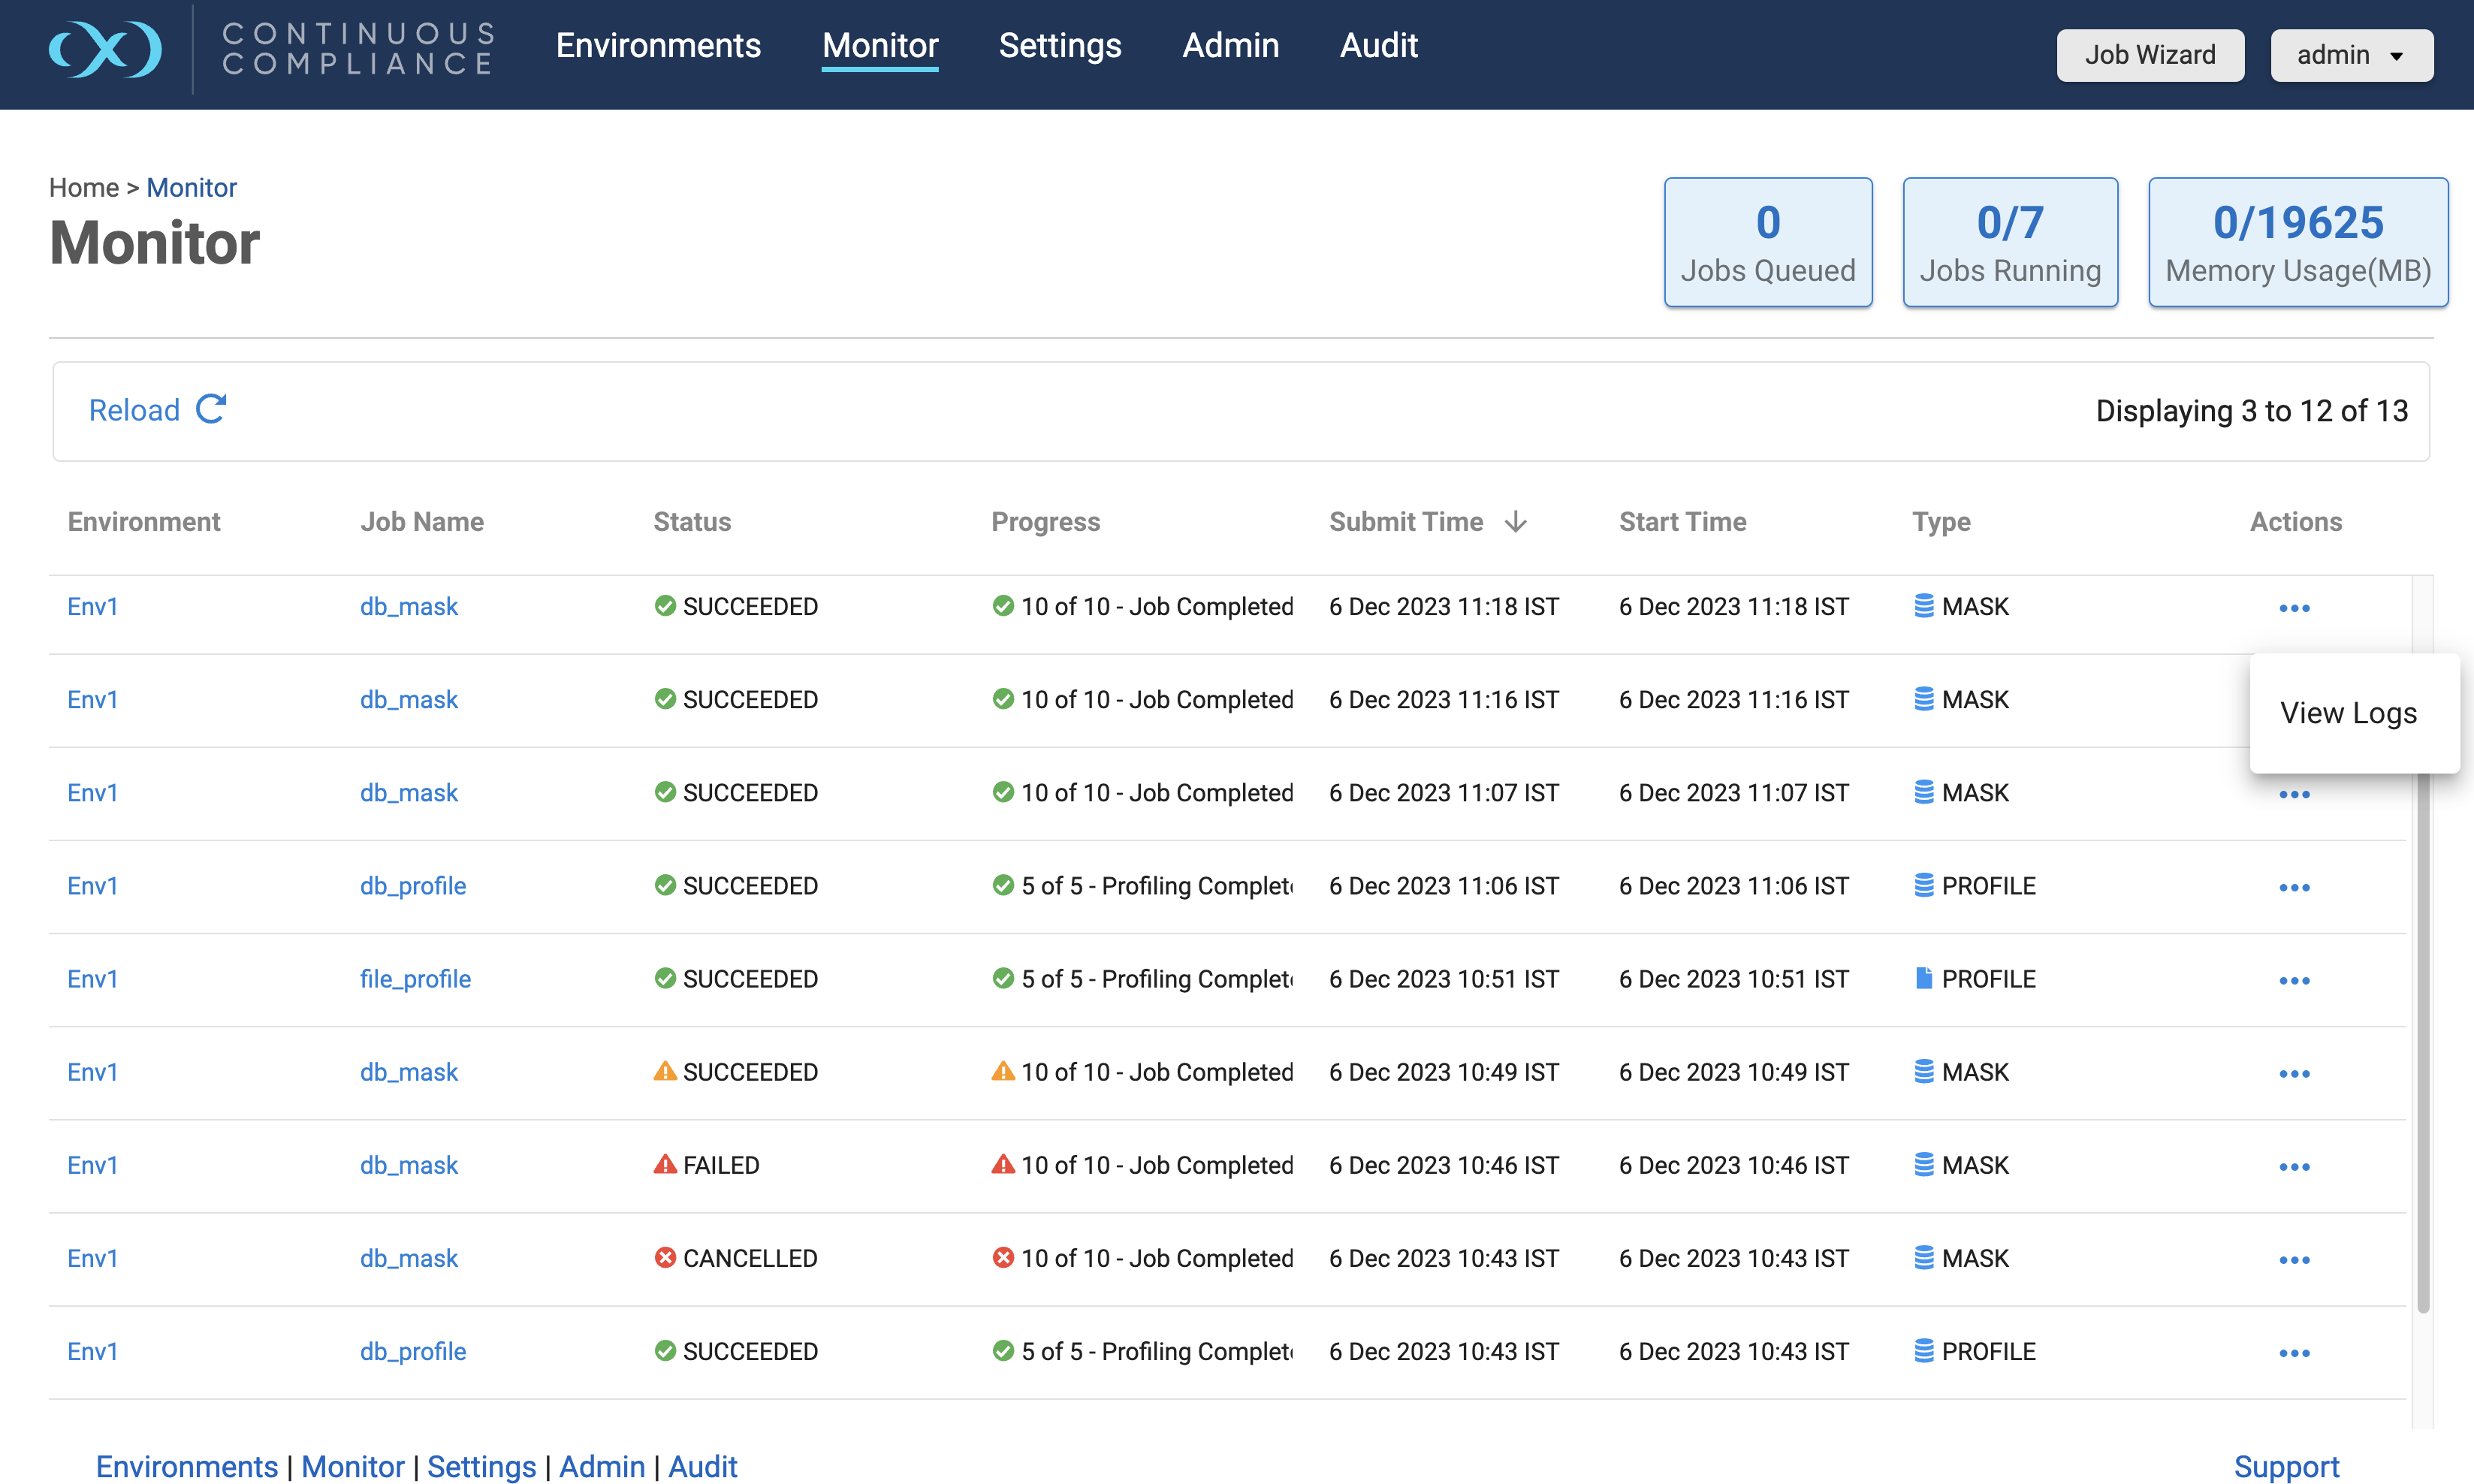
Click on View Logs from the Action (…) button to the right of the corresponding execution, if you want to view the logs of completed execution.
Sorting on Monitor grid
Use these steps to sort the grid based on any one of the grid column data.
-
Click on any sortable column header on the grid. The records in the grid will be sorted based on the data in that column.
-
Click on the column again to change the sorting order. A vertical directional arrow symbol indicates the sorting order applied (↑ Ascending, ↓ Descending, and blank default sorting order).
-
Sortable columns are: Environment, Job Name, Status, Submit Time, Start Time, Type
Sortable columns are Environment, Job Name, Status, Submit Time, Start Time, and Type.
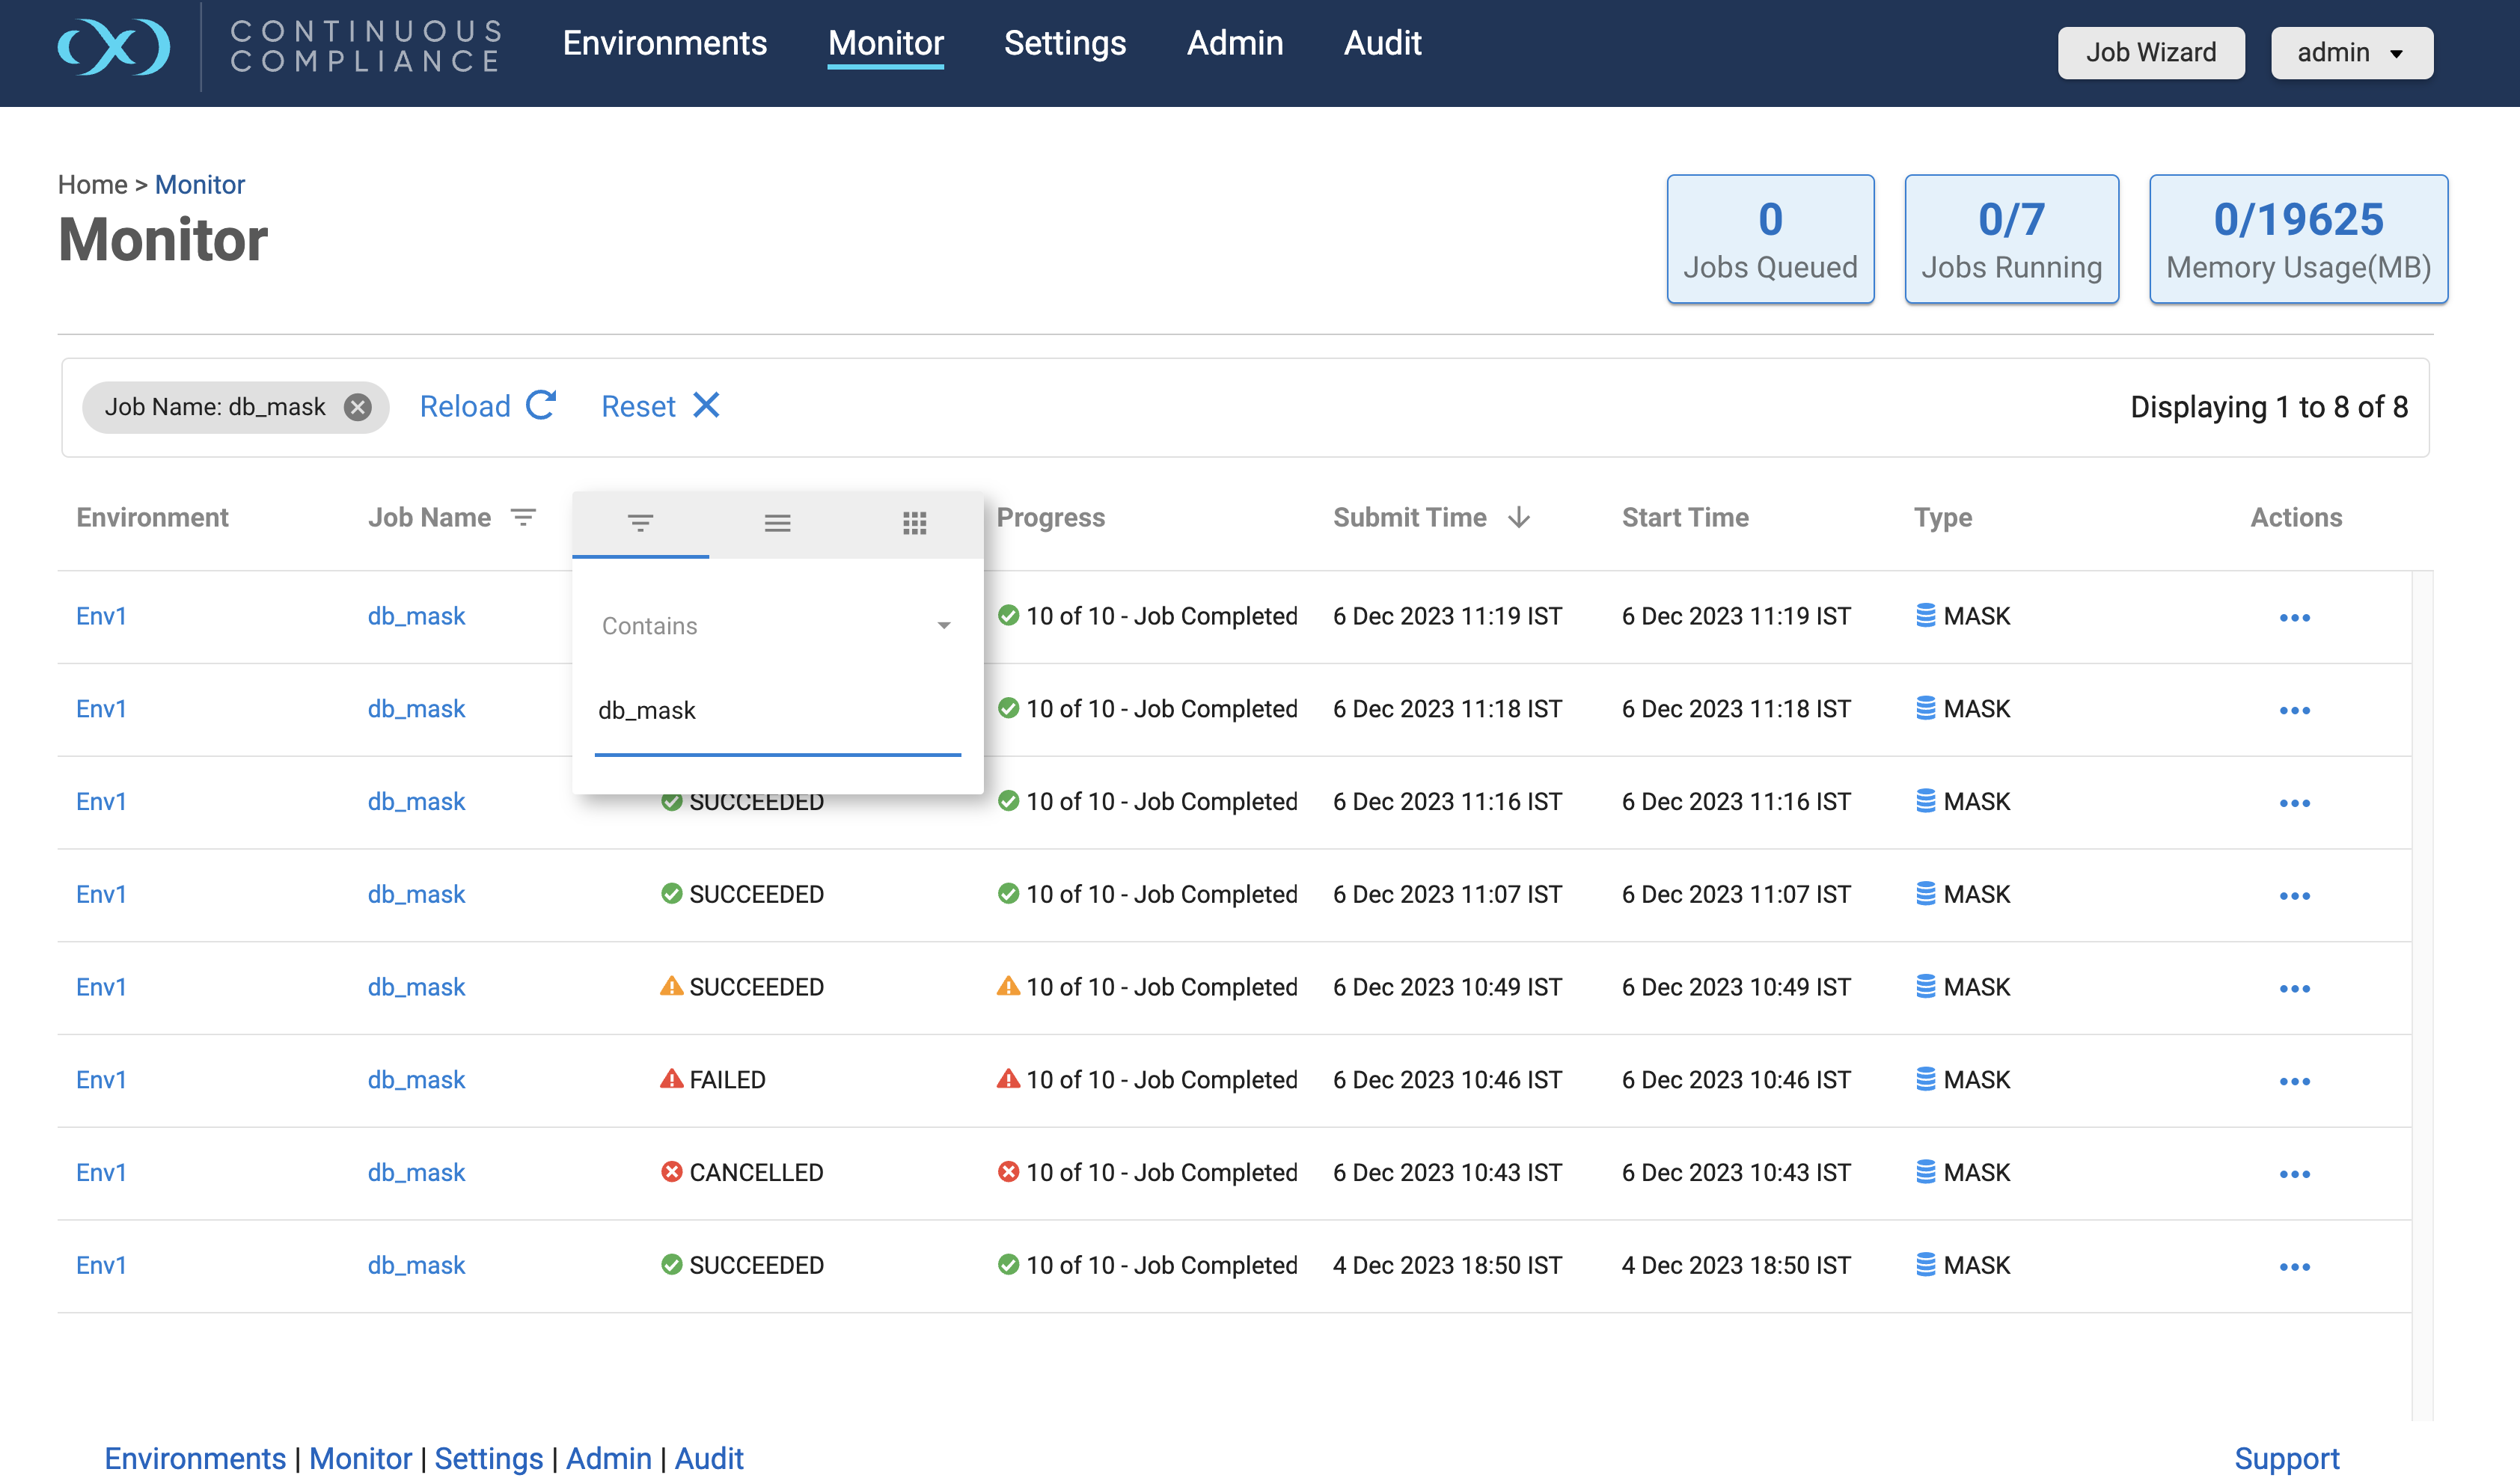
Filtering on Monitor grid
Use these steps to add a Filter on the grid to show columns or fields only matching certain criteria.
-
Hover on the filterable column header of the grid and click the ꠵ icon that appears in the right corner.
-
When the dialogue appears, choose the first tab, then select a required filter criteria and provide the required inputs to filter the grid.
-
To remove a filter criteria, click on the cross mark on the applied filter criteria value listed before the Reload button, just on top of the grid.
-
To remove all filter criteria click on the Reset button.
-
These filters will be persisted in the browser cache until the user resets it or clears the browser cache.
Filterable columns are Environment, Job Name, Status, Submit Time, Start Time, and Type.
Event Status
The following table lists the states of a masking job/event.
|
Job Status Icon |
Status |
Description |
|---|---|---|
|
|
Cancelled |
It appears when a user cancel a running task/execution. |
|
|
Failed |
It appears when there is an error in the execution of an event in the task/execution. |
|
|
Queued |
It means the events of the task/execution are yet to start. |
|
|
Running |
It appears when the event is in progress. |
|
|
Succeeded |
It means the event is completed successfully. It appears when the event is successful. |
|
|
Skipped |
It appears when the event is skipped and process moved to the next event of the task/execution. |
|
|
Non-Conformant |
It appears when an event of the task/execution is successful but with warning. |
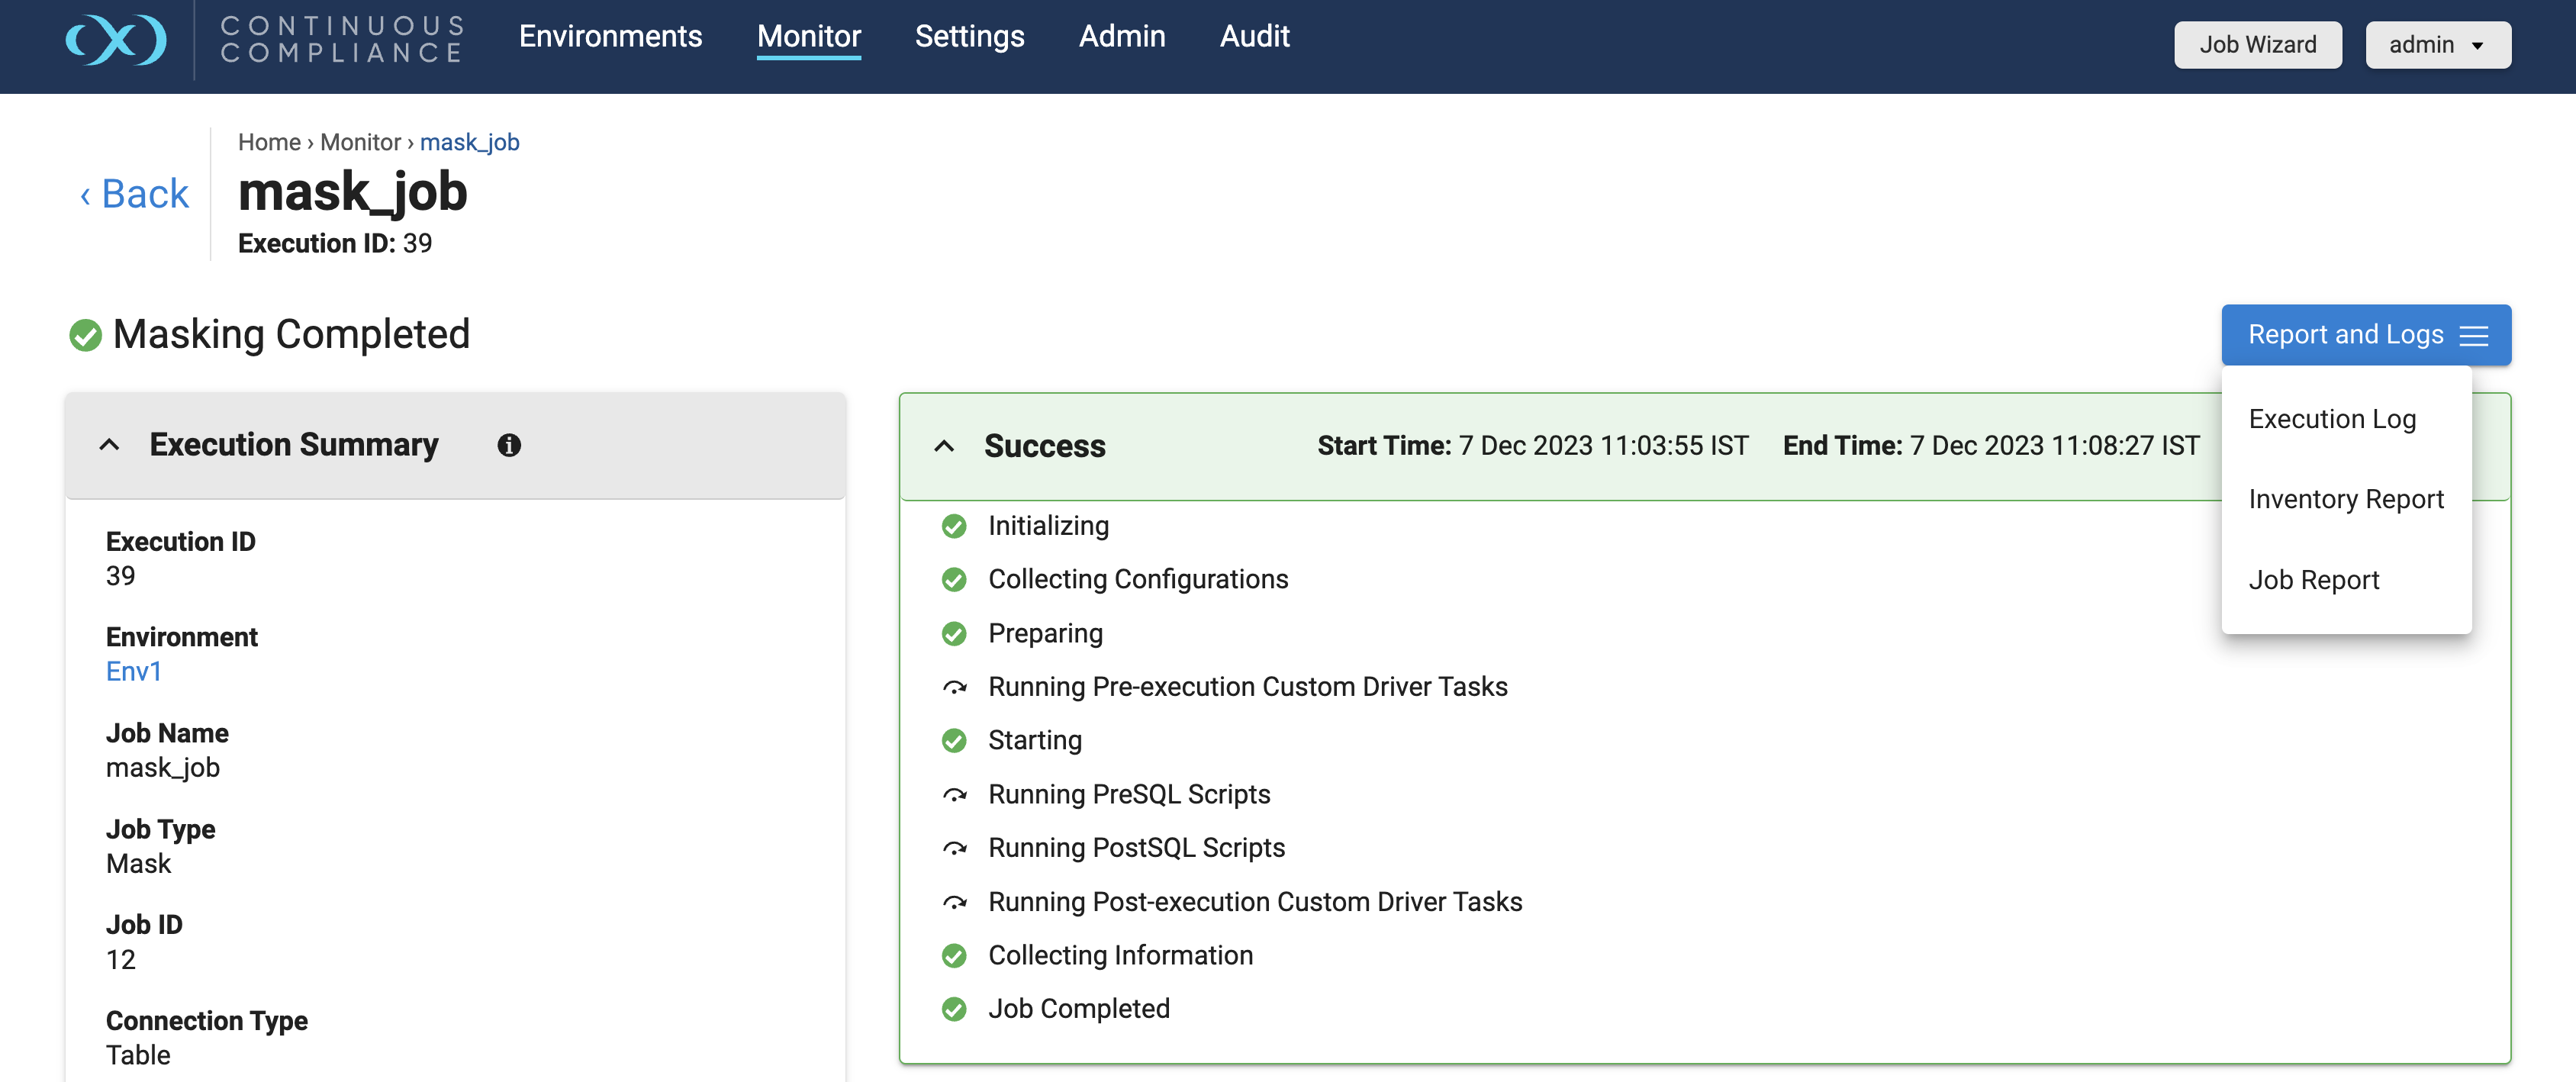
Monitoring a single job
In addition to viewing high-level stats about the status/progress of all your jobs, you can also deep dive into each job to get more details by clicking on the job name from the Monitor grid.
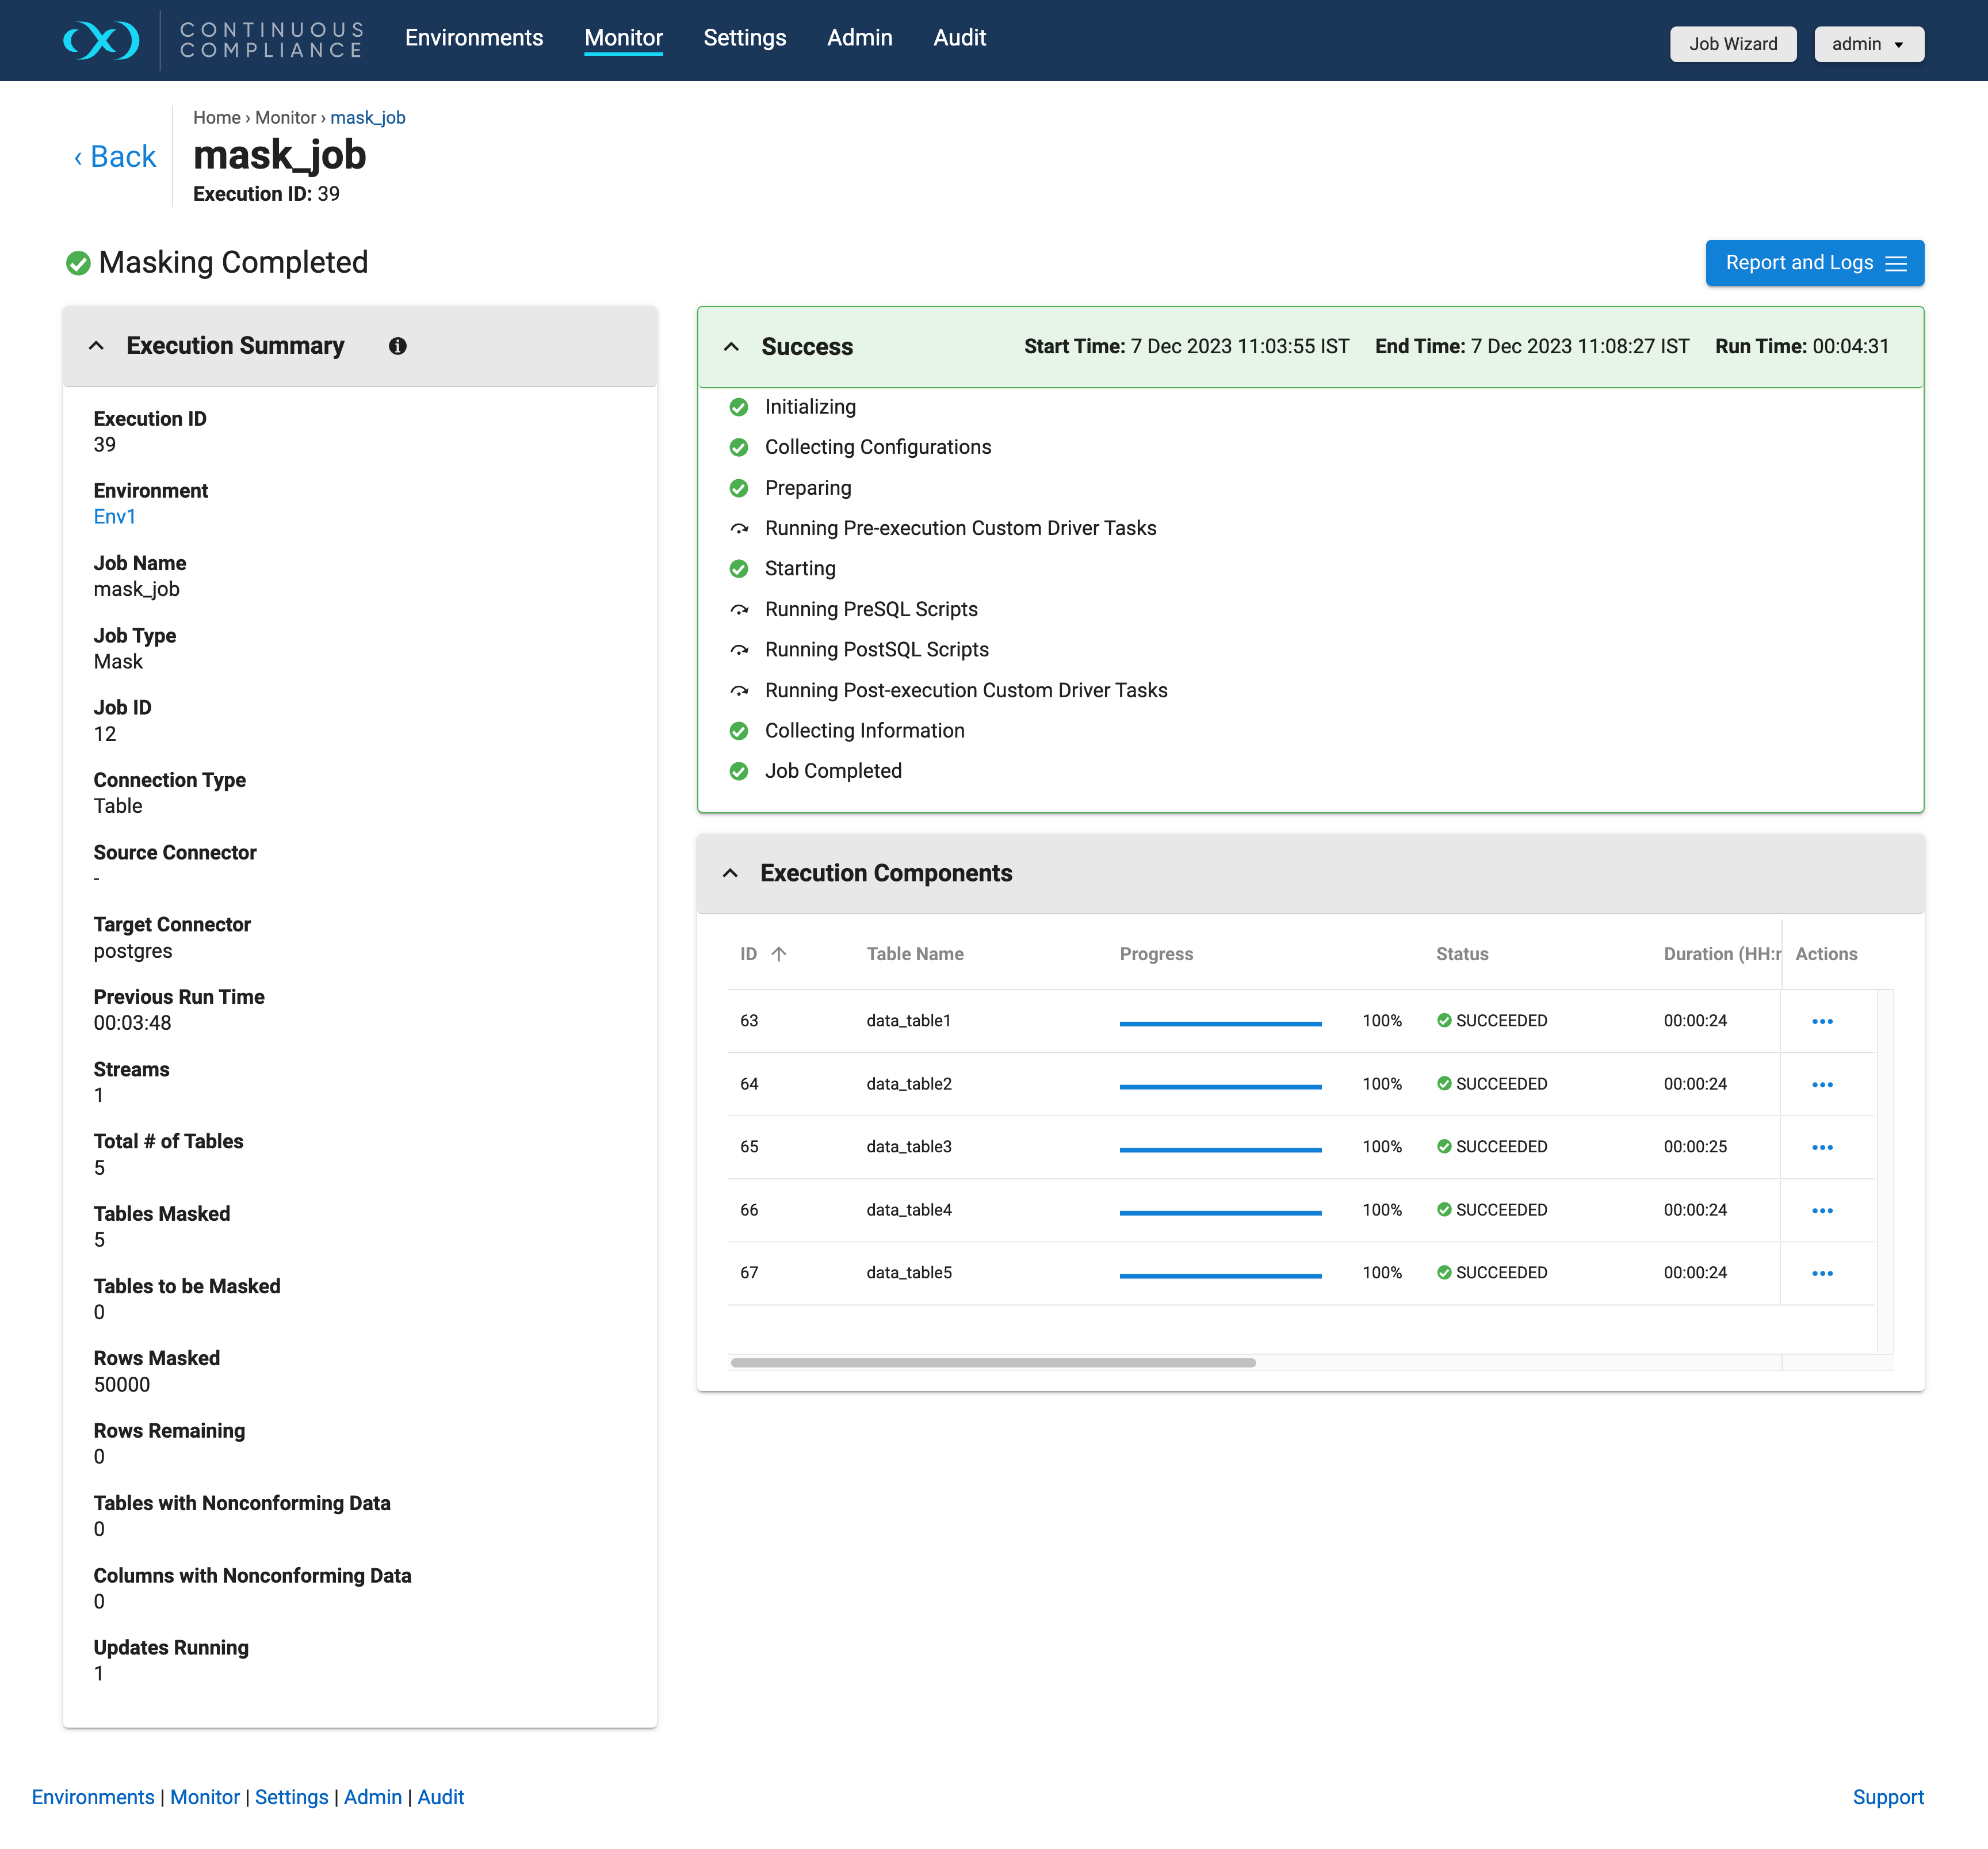
Execution Summary
This section displays more granular information about execution including; Environment name, Connector name, Job Name, Previous run time, Number of tables/files in the job, Number of tables/files masked, Number of tables/files to be masked, Type of job, Rows remaining to mask, Rows masked, Number of streams, etc.
Events
This section displays the Start time, Run Time, and End time of the job and also the sequence in which the events are executed.
The events are executed in the following sequence:
-
Init Execution: The execution has begun.
-
Collecting Job Configurations: Collect the Job details stored in the MDS/DB.
-
Preparing Execution: Create transformation XML for a kettle that includes, pre-script, post-script, create and drop identity XML.
-
Execute Pre-Execution Custom Driver Task: Execute custom drive pre-execution tasks.
-
Start Execution: Starts the masking Job
-
Pre SQL Script: execution prescript if available
-
Post-SQL Script: execution postscript if available
-
Execute Post Execution Custom Driver Task: Execute post-SQL operations from the custom driver
-
Collect Job Information: Collect and store execution information in the database.
-
Execution Finished: The execution is finished and removed from monitoring
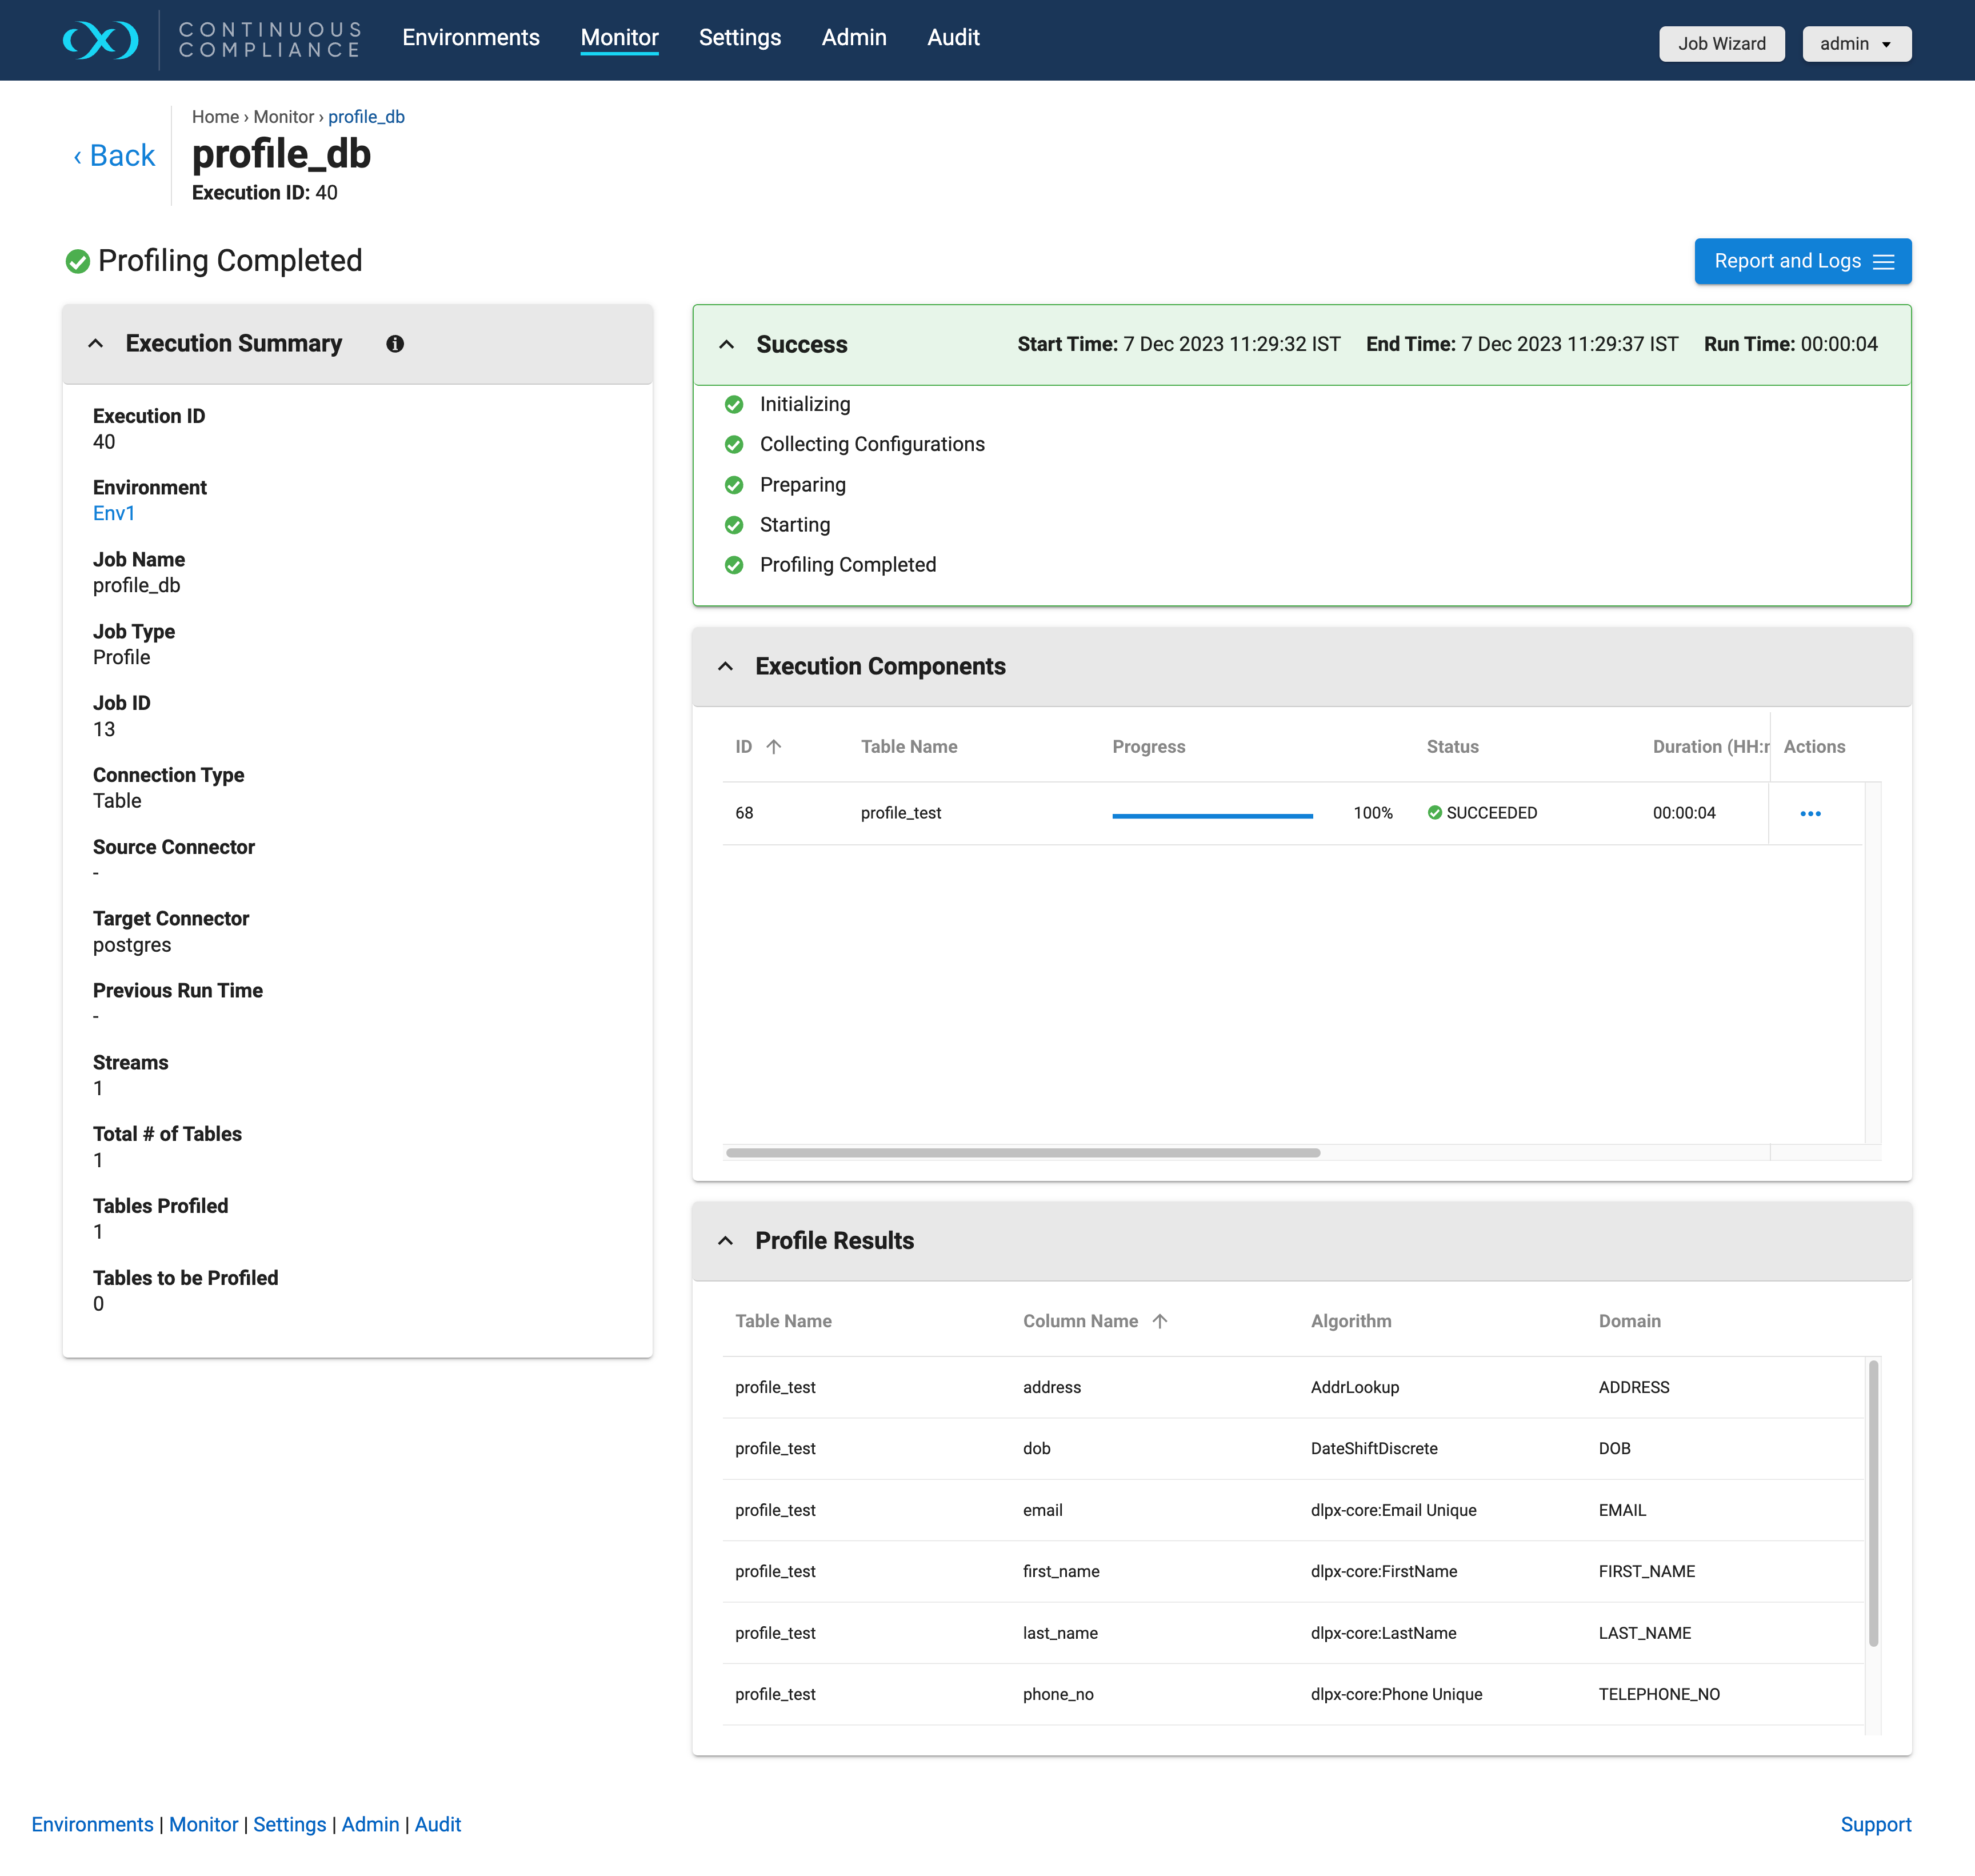
Execution Components
In addition to seeing this information about each job, you can look into the status/progress of each table/file defined in the job. Each table/file will be displayed under Execution Components. It includes information such as Time taken for processing, Rows Masked per Minute, Rows Masked, Rows Remaining, Number of columns/fields having Non-conformant data, etc. It also gives the option for viewing logs for individual tables/files.
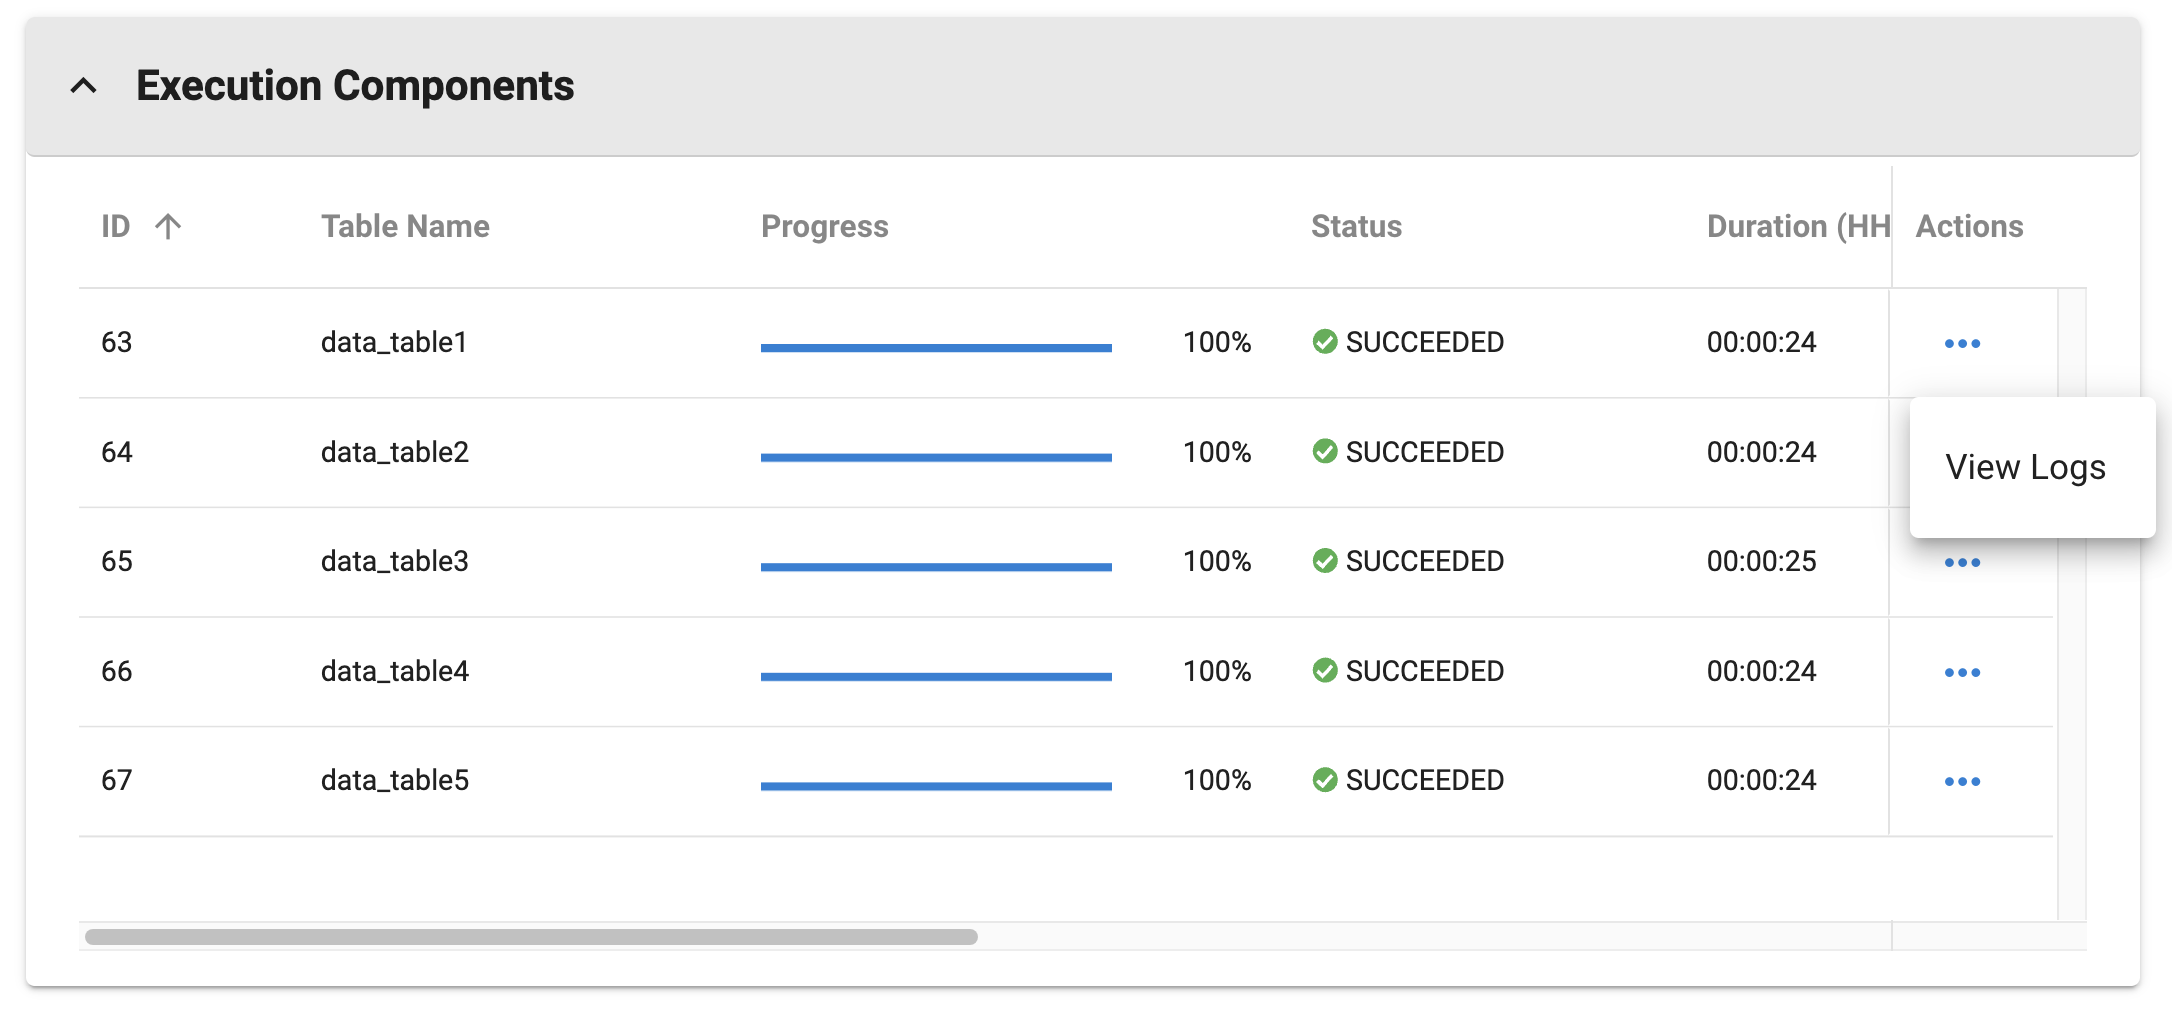
Execution components grid supports sorting and filtering on ID, Table Name, Status and Rows Masked columns.
Report and Logs
Using the Report and Logs button users can retrieve Job and Inventory Reports in PDF formats. From this screen, the user can also view logs for this execution by clicking on “Execution Log“.
Profile Results
This section comes for Profiling jobs. It displays the sensitive data findings on a table-column by table-column or file-field by file-field basis.
Displaying non-conformant data
When a masking job encounters non-conformant data, the job will either Fail or Succeed with a warning, depending on how the algorithms associated with the ruleset for the job are configured. As depicted in the screenshot, the non-conformant data can be accessed via the Execution Components on the Monitor page for the job, which can be accessed by clicking on the Job name from the Monitor Grid. In the Execution Summary section, a summary of the Tables with Nonconforming Data and Columns with Nonconforming Data is reported. Further details on the non-conformant data encountered can be accessed by clicking the “View Logs“ on each table or file listed in the Execution Components grid.
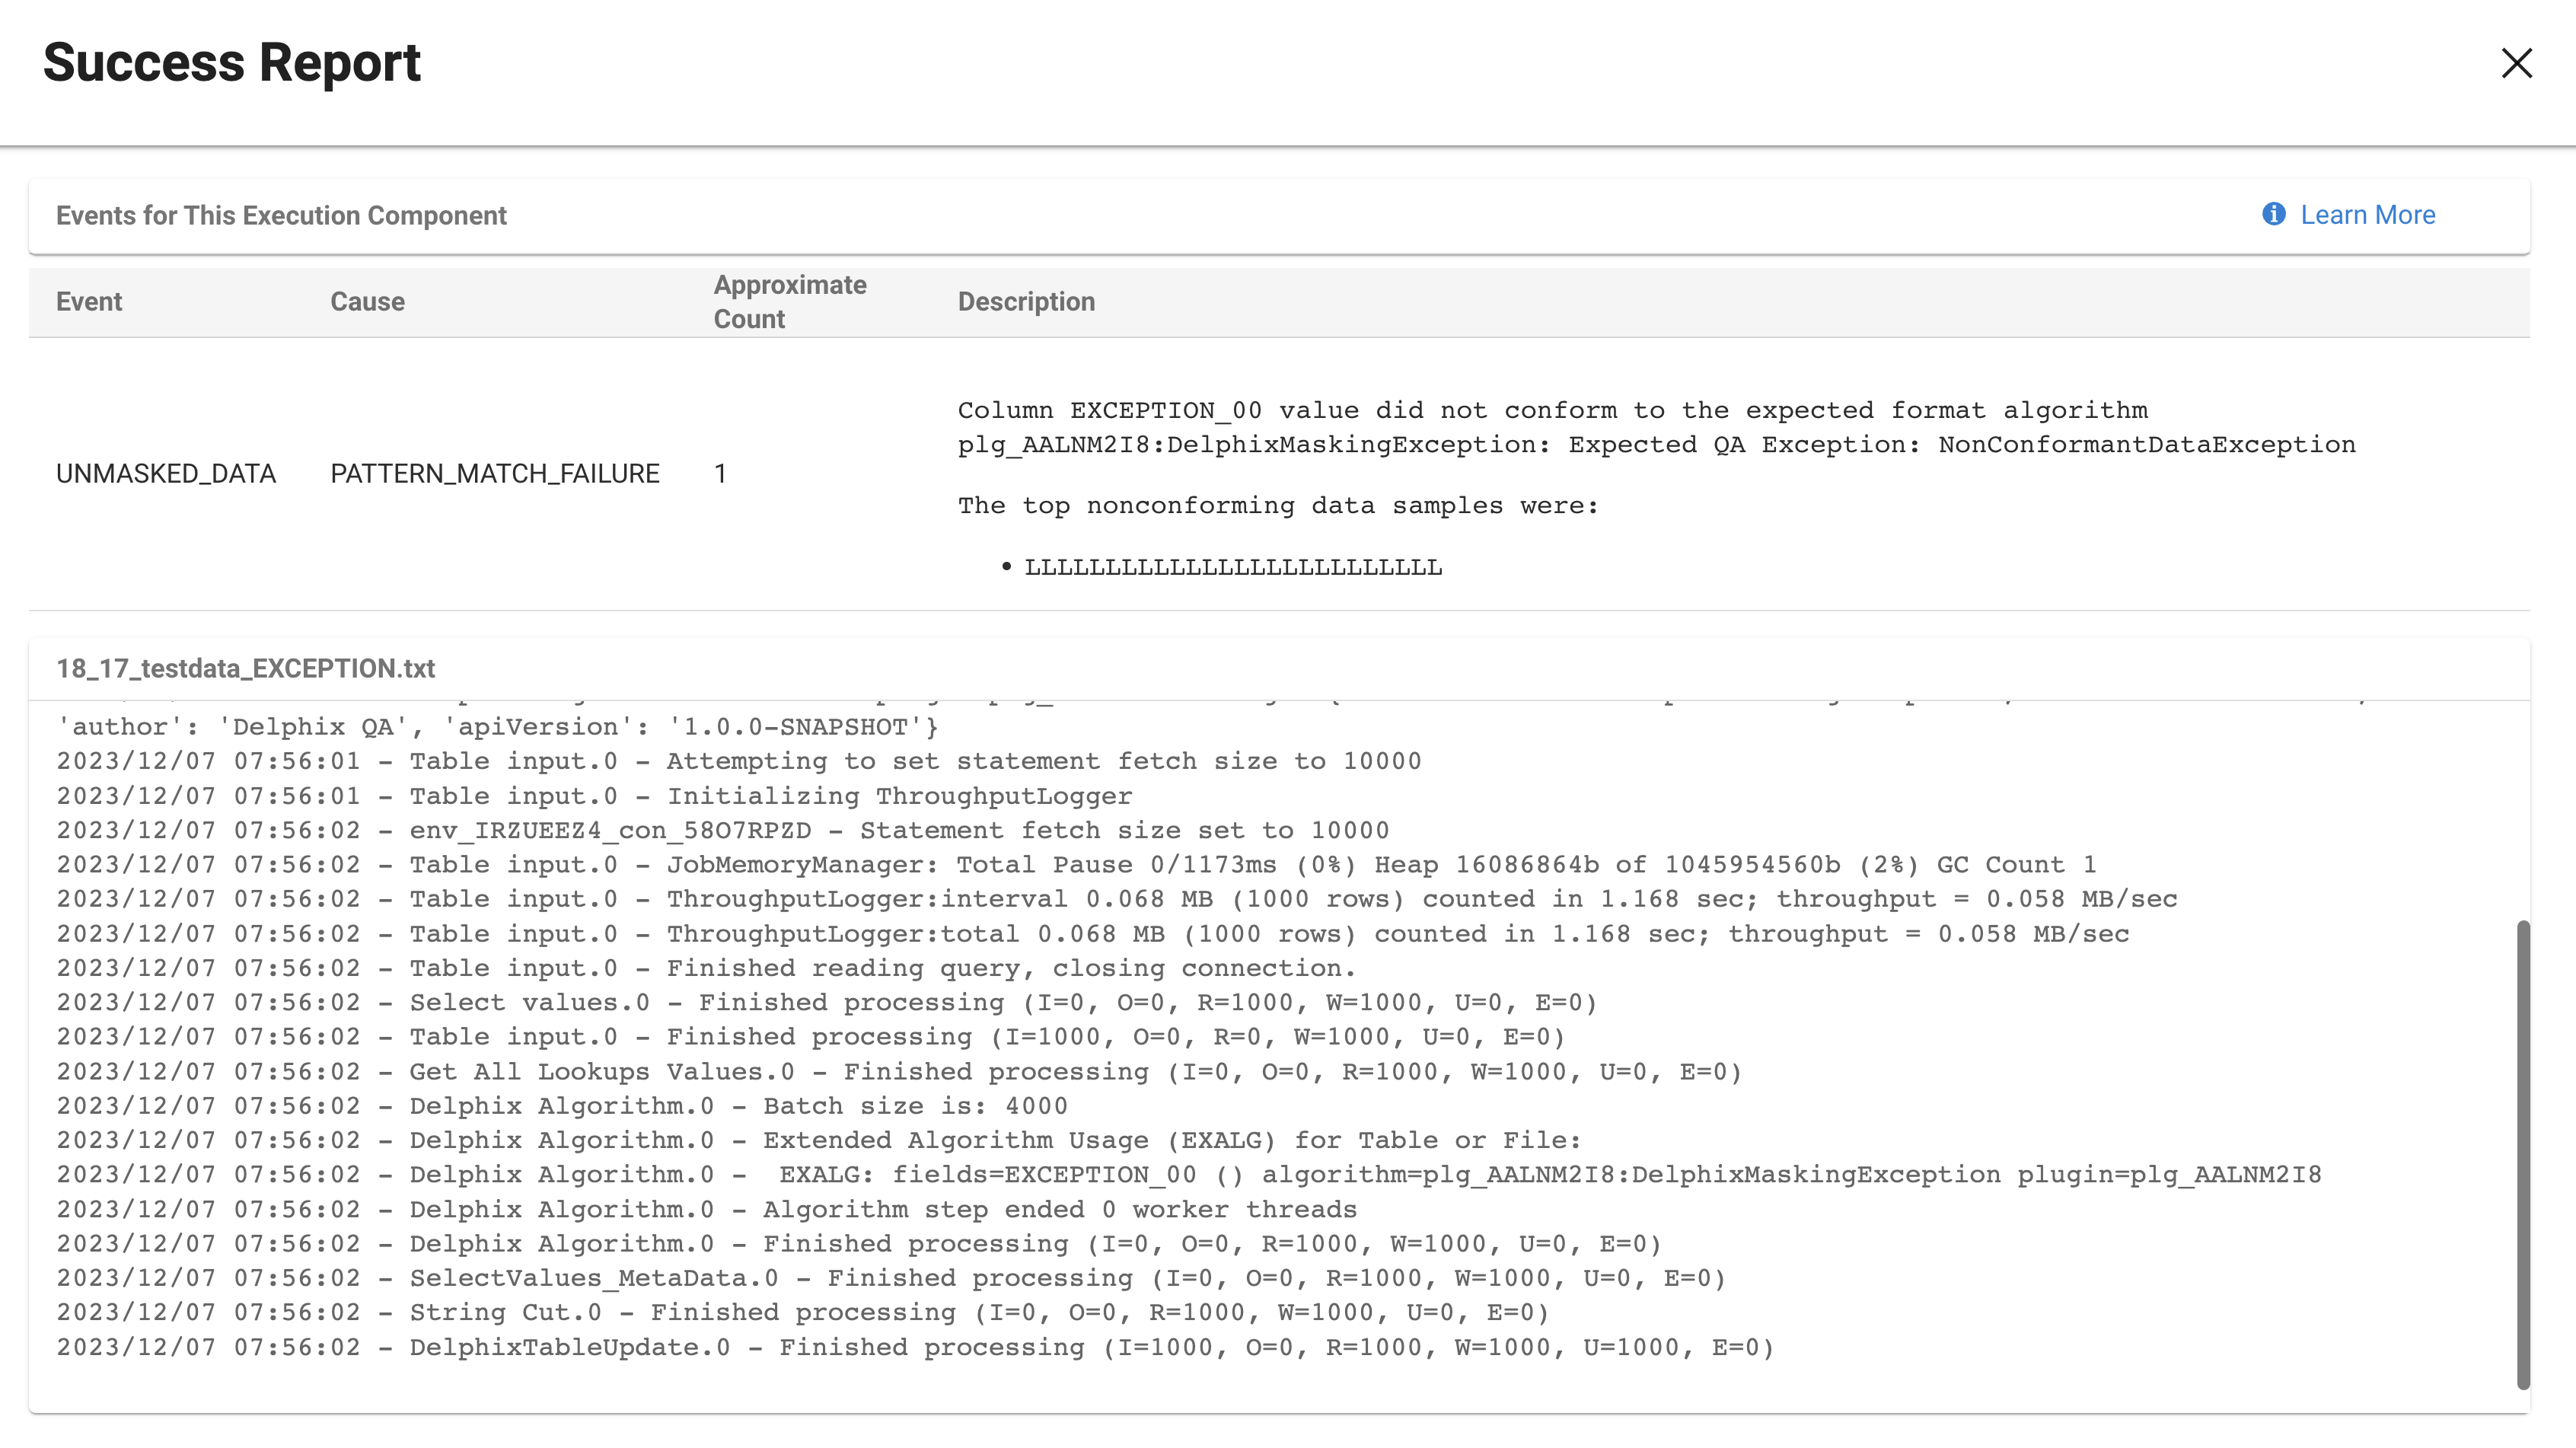
The non-conformant data events are displayed followed by the masking log for the table or file. If there were no non-conformant data events, "No Events to Display" is displayed, otherwise, for each type of non-conformant data, a row will be displayed with the following information:
-
Event type: Either JOB_ABORTED or UNMASKED_DATA if the job was not aborted.
-
Cause: Always PATTERN_MATCH_FAILURE.
-
Approximate Row Count: Approximate number of rows with non-conformant data (at least within an order of magnitude).
-
Description: Details the name of the column or field with non-conformant data
Interpreting samples of non-conformant data patterns
Each character in the non-conformant data is sampled per its Unicode Character Property.
-
N for digits
-
L for letters
-
M for marks
-
P for punctuation
-
S for symbols
-
Z for separator
-
O for other
-
U for unknown
Tracking Non-conformant Data
Please note that actual personal data is never displayed, only the samples (a.k.a. patterns) of non-conformant data are displayed on this page
Using the database-specific SQL query, it is possible to locate data corresponding to the non-conformant data sample. The table and column names can be found on the table report. In the example above, the table name is "testdata_EXCEPTION" and the column name is "EXCEPTION_00".
Note
The pattern might be not an exact representation of the data in the field, but a part of the data. For instance, white spaces at the beginning or at the end of the data might be truncated.
Oracle example
Below are the Oracle character classes, used in the regular expression:
|
Character Class Syntax |
Meaning |
|---|---|
|
[:alnum:] |
All alphanumeric characters |
|
[:alpha:] |
All alphabetic characters |
|
[:blank:] |
All blank space characters. |
|
[:cntrl:] |
All control characters (nonprinting) |
|
[:digit:] |
All numeric digits |
|
[:graph:] |
All [:punct:], [:upper:], [:lower:], and [:digit:] characters. |
|
[:lower:] |
All lowercase alphabetic characters |
|
[:print:] |
All printable characters |
|
[:punct:] |
All punctuation characters |
|
[:space:] |
All space characters (nonprinting) |
|
[:upper:] |
All uppercase alphabetic characters |
|
[:xdigit:] |
All valid hexadecimal characters |
For the LLLLL sample in the example above, the Oracle DB SQL query would look like this:
SELECT EXCEPTION_00 FROM testdata_EXCEPTION WHERE regexp_like(EXCEPTION_00, '[[:alpha:]]{5}');
For the LLLLZLLLZLLLL sample, the Oracle DB SQL query would look like:
SELECT EXCEPTION_00 FROM testdata_EXCEPTION WHERE regexp_like(EXCEPTION_00, '[[:alpha:]]{4}[[:space:]][[:alpha:]]{3}[[:space:]][[:alpha:]]{4}');
Limitation for the multi-column extensible algorithm
If a Non-conformant data pattern is encountered - it is displayed for all the masked columns of the MC Algorithm, not only for the column where that event has occurred. In that case, the manual analysis of the error message will be required to find the actual column(s) with the Non-conformant data.